The Trace Data Problem
And why it matters
I recently wrote a piece discussing how I defeated the Ethereum DDos attack using TrueBlocks. Doing this was important because it freed me from the pain of a slow RPC. Speed allows me to analyze the Ethereum data iteratively. I can find more interesting stuff.

The Ethereum dataset is big (and growing). I want to be able to scan through the entire thing. I want to be able to do this on a laptop. This last fact makes it impossible for me to create a separate, independent copy of the data. If I want to do data analysis, I have to do it against the node’s data directly.
In this article, I am going to try to help you understand why the Fall 2016 DDos presents such a severe problem if one is trying to scan the node’s data directly. By the end of the article, I hope you understand why the RPC is so freaking slow.
You may download the data I produced for this story and play around with an interactive graph here and here. Let’s dive in to the data.
Traces per Transaction
I scanned each of the first 5,000,000 blocks. At each block, I scanned all the transactions in that block. At each transaction, I counted the number of traces generated by that transaction. (Parity delivers one trace for every transaction plus more traces whenever a transaction sends ether to an account, calls into a smart contract, creates a new smart contract, or suicides.)
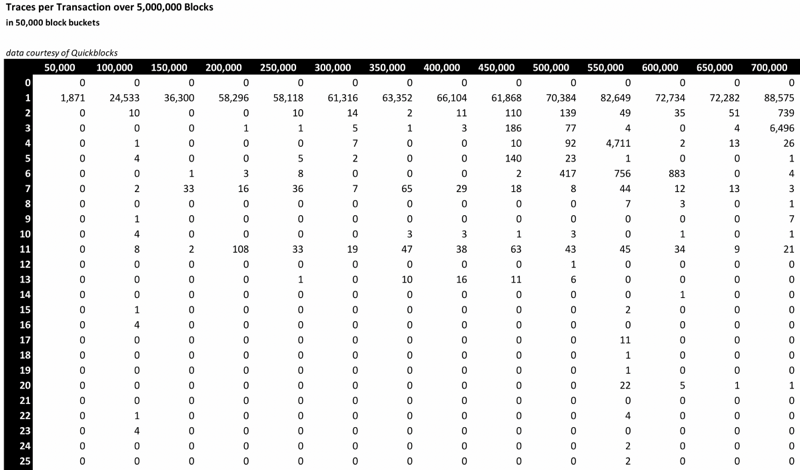
I scanned groups of 50,000 blocks at a time and incremented a trace counter each time the transaction had that number of traces. Below is the top-left corner of the data. Groups of blocks go across the top of the table. The number of transactions with the given number of traces appears in each cell. For example, in the first 50,000 block group, there were 1,871 transactions all of which created a single trace. Between blocks 150,000 and 200,000, there were 108 transactions that created exactly 11 traces (for a total of 1,980 traces — this will become important later).
Here’s the top-right portion of the data along with totals for the number of transactions with that many traces and the corresponding percentage of all transactions this represents.
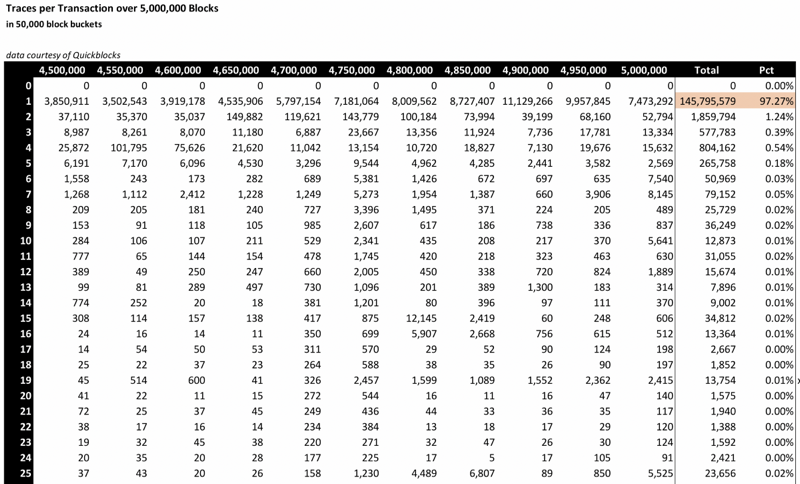
As you can see, almost every transaction ever cast against the Ethereum blockchain created a single trace. (Transactions themselves generate one trace which explains why there are no zero-trace transactions.) 97.27% of all transactions either sent ether from one account to another or transacted against a smart contract but did not do anything further.
Every transaction cast against the chain from the outside is an external transaction. Some transactions, however, create what are called internal transactions or message calls. Of this first group of transactions (the 97.27%), zero internal transactions were created. In fact, 99.62% percent of every transaction created five or fewer traces.
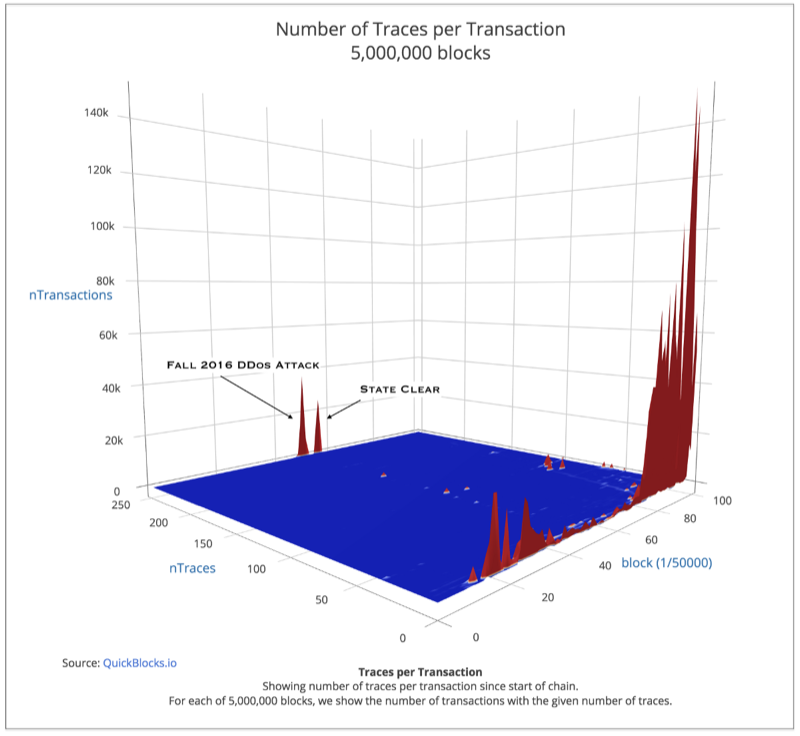
There is one group of transactions that created more (many more) than five traces. These are the 101,637 transactions (0.07%) DDos transactions from the Fall of 2016. Each of these transactions has more than 250 traces. We will look at these transactions next. First, let’s look at a 3-D picture:
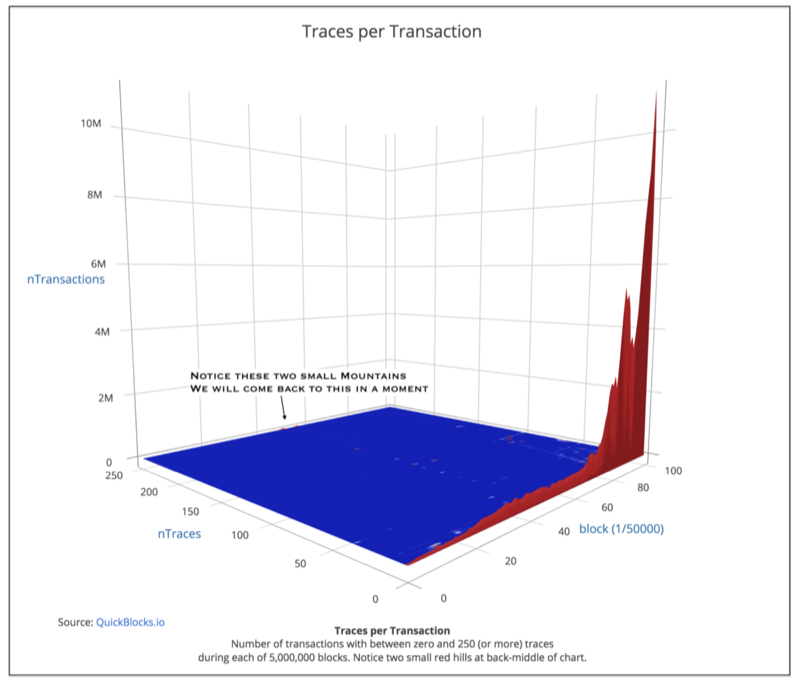
You can see the complete dominance of the one-trace transactions in red. But notice the two small red hills at the very rear of the chart. (The further back one looks on this chart, the more traces appeared in those transactions — the further right one looks, the higher the block number.) Also, notice the coloration of the ‘great plains.’ One can see the beginnings of a heat-map in the patchy colors in the plains (we will revisit this a bit later).
Let’s spin the view around and look at it from behind:
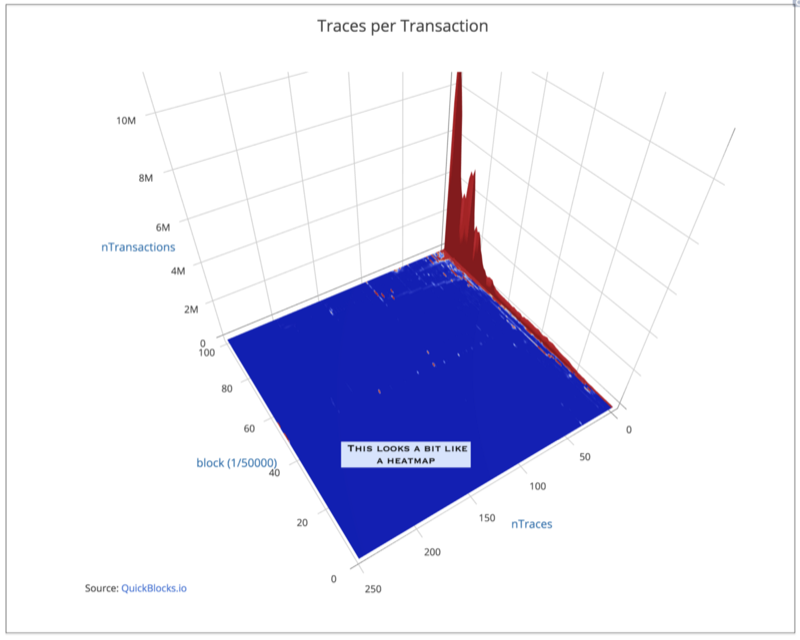
Here, you can see the same data from the other side. The dominance of the one-trace transactions (in red) is apparent here as well. And, also, you can start to see that as the chain matures, we are seeing a growing number of transactions with multiple traces.
What happens if we remove the one-trace transactions so we can see more clearly? What do we see then?
In the above chart, we’ve removed one-trace transactions. Every transaction here created at least one internal transaction or message call. We are now starting to see the problem that I call the Trace Data Problem.
The red spikes at the front of the chart between block groups 20 and 40 is The DAO. One can see the crowd sale (which had two humps) and the subsequent DAO hack pretty clearly. The huge red spikes near to the right-front side of the chart (between block groups 80 and 100) are most likely Crypto Kitties.
Please notice, however, the two sizable spikes at the rear of the chart. These two spikes represent the DDos attack and then, after a pause, the solution to the DDos attack. It doesn’t look too bad, but as we will see these two collections of transactions are much worse than they look. Every chart so far represented a count of the number of transactions given that number of traces.
A transaction with a single trace generates that number of traces. A transaction with two traces generates twice as many traces as transactions. For the DDos transactions — each of which has thousands of traces — the number of traces becomes very large indeed, and this is the crux of the problem.
Let’s look at a chart showing the number of traces per 50,000 block group as opposed to the number of transactions per group.
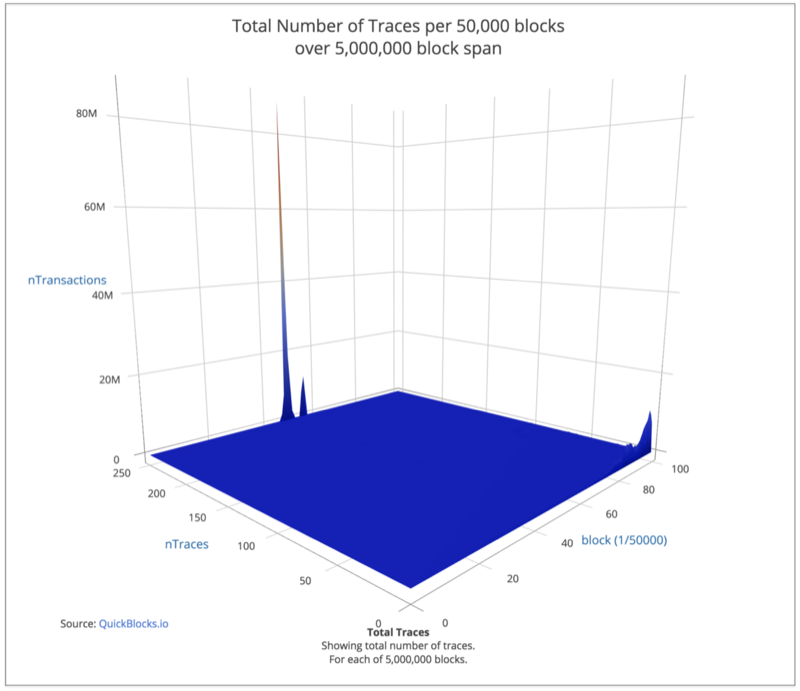
We can see here why scanning the Ethereum blockchain — especially when one is looking at traces — is so onerous. To get through just 100,000 transactions, one must scan more than 138 million traces. This is why the RPC is so slow. (I suspect that this is also why it takes so long to sync the blockchain.)
Let’s look at some numbers:
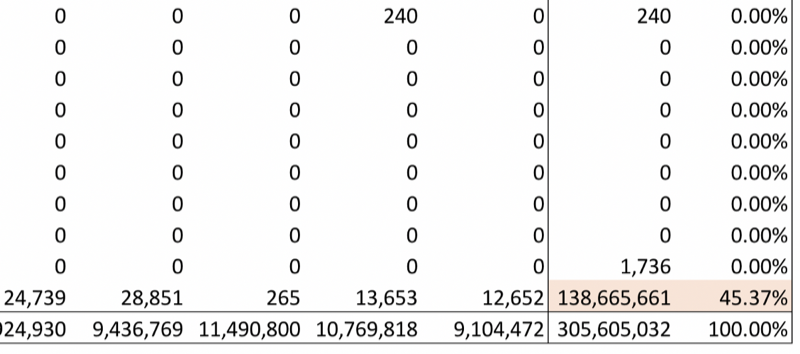
In the first 5,000,000 blocks, there have been 305,605,032 traces created. Of those 138,665,661 (45.37%) were generated by the 101,637 transactions that were part of the DDos and its solution. This is an average of more than 3,000 traces per DDos-related transaction. The entire rest of the chain created 166,939,371 traces spread across 149,758,364 transactions — an average of slightly more than 1.1 trace per transaction.
Upshot
The Ddos attack was bad. It created more than 20,000,000 empty accounts. This caused a huge bloat of the state database which had to be cleaned up. It was absolutely necessary to correct the problem by removing those dead accounts, and the Spurious Dragon hard fork did that, albeit by creating a lot of additional traces. The solution to the Ddos problem created nearly a third again as many traces as the attack itself. This is one of the downsides of an immutable data structure such as a blockchain. At TrueBlocks, we’re doing everything we can to not let this stop us from looking at the data — we are constantly looking at the data…
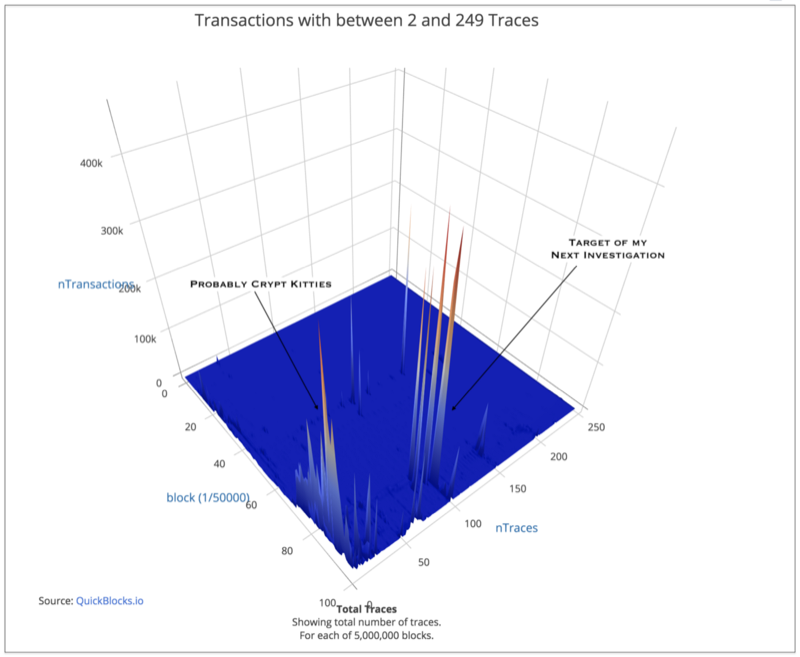
In our next blog post, we will ignore both the Ddos attacks and the single-trace transactions and start looking into what else is happening on the Ethereum blockchain. Below are a couple more pretty pictures. In these charts, we’ve removed both the single-trace transactions and the DDos transactions.
Do you see anything interesting? We do. We’ll write about that in our next installment.
Support Our Work
We’re interested in your thoughts. Please clap for us and post your comments below. Please consider supporting our work by sending a small (or large) tip to 0xf503017d7baf7fbc0fff7492b751025c6a78179b.
Thomas Jay Rush owns the software company TrueBlocks whose primary project is also called TrueBlocks, a collection of software libraries and applications enabling real-time, per-block smart contract monitoring and analytics to the Ethereum blockchain. Contact him through the website.