It’s Growing! It’s Growing!
Will it ever stop?
I spend much of my free time on the Ethereum Stack Exchange answering questions about Solidity and asking questions about the Ethereum data, so I’m well aware which questions are most frequently asked.
By far, the most repeated question on that forum is how long it takes to sync the Ethereum blockchain using geth or Parity. The short answer to that question is It takes forever. But this is only a perception. In real life, the sync actually does come to an end. It just takes a very long time.
I recently re-synced the Ethereum blockchain from scratch using Parity. It took more than 24 hours (which is not too bad, to be honest). You can see why it takes so long in the chart below. Do you see that huge spike around block 2,380,000? That spike is one of the reasons the sync takes so long. This is the DDOS attack that instigated the tangerine dream hard fork.A few weeks later, the spurious dragon cleaned up the mess.
But this post is not about syncing — it’s about what’s been happening to the blockchain data since then.
What Happens When the Masses Adopt?
As many of my readers will know, there has been a huge increase in interest in the Ethereum blockchain over the last few months. We were curious what effect this attention has had on the size of the database (and therefore on the time to sync).The data we present below is based on the TrueBlocks database, which is different than the actual Ethereum data, but is representative of it.
TrueBlocks ensures speed of access to its data through various techniques, one of which is how we store the data on disc. At the time of this article, there were 3,800,000 blocks on the current chain. TrueBlocks stores 1,000 blocks per file in each of 3,800 files, providing a compromise between speed of access and size on disc. We take advantage of this 1,000 block per file data to present the following chart.
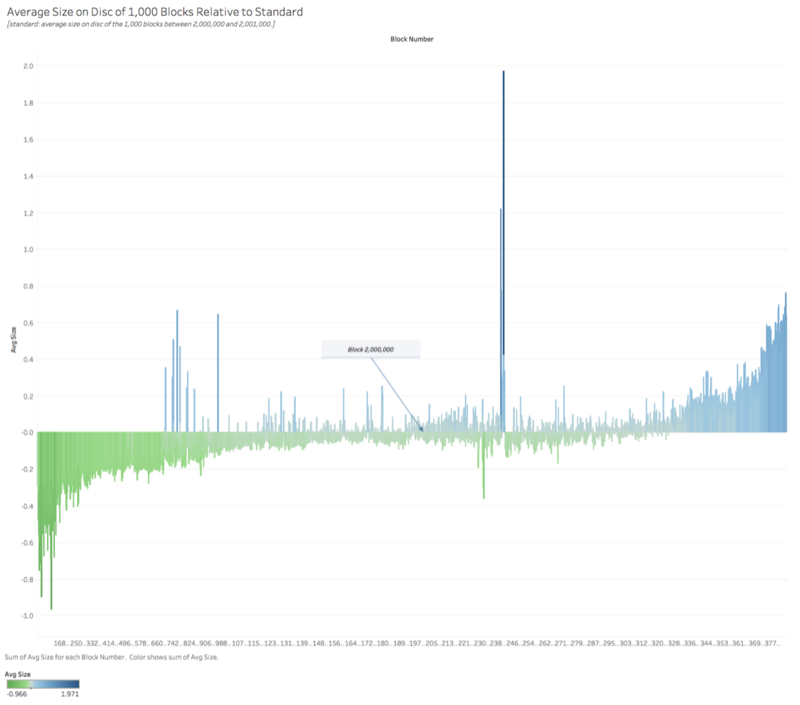
Because we wished to study the data relative to previous activity, we first calculated the average size of a block for the 1,000 blocks between block 2,000,000 and 2,001,000. We then used this value as a divisor for each previous and subsequent 1,000 block average and charted the results. Viewing the data relative to a fixed mark accomplishes two things: (1) it smooths out the greatly varying data so as to better focus on overall trends, and (2) it allows us to more clearly see where the size of the data on the chain is coming from, and importantly where it’s going.
A few things stand out:
- For most of 2016 and the first part of 2017, the average block size per 1,000 blocks remained relatively constant. This is indicated by the up and down nature at the middle of the chart.
- The DDOS attack during October 2016 is very clearly visible as is the effectiveness of the spurious dragon hard fork.
- I think we may be headed for trouble.
Why Does the Sync Take So Long?
We focused our analysis on the size of the data because it’s a proxy for the time needed to sync the chain. As I mentioned above, I spend a lot of time answering questions about why it takes so long to sync the chain. Until now, I’ve always advised people to be patient while trying to sync the blocks near block 2,380,000. It is apparent from the above chart that I need to amend my answer.
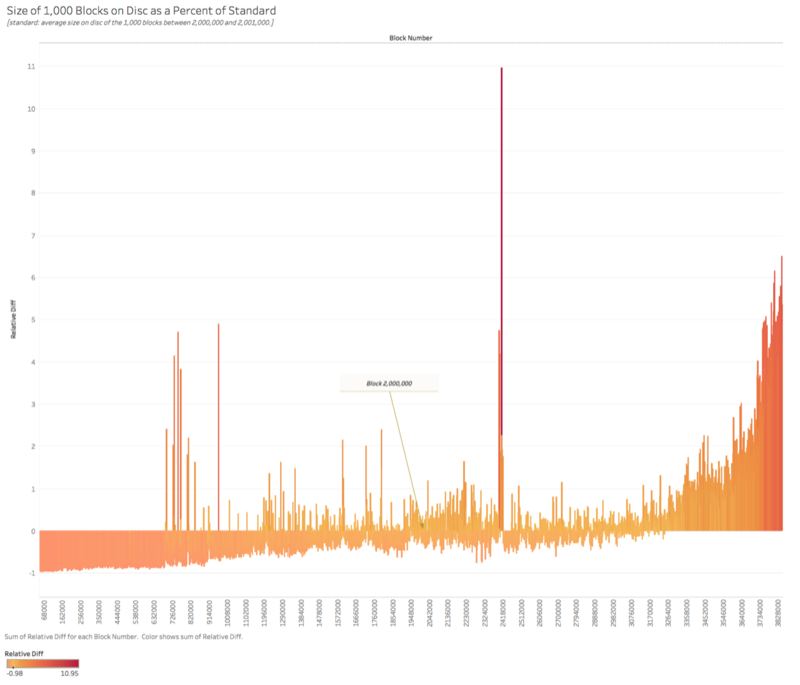
The area under the graph above is an important thing to consider. The slowing down of the sync time from the DDOS attack is reflected in its area under the chart. This amount of time is about to be eclipsed by the natural growth of the data given the recent attention to Ethereum. The time to sync is headed sharply up. You thought it was slow to syncing the before.
Below is another chart presenting basically the same data but this time we present as a percent of the reference blocks. Here we see the effect is even more pronounced. The size of the 1,000 block groups for recent blocks is nearly 50% of the height of the DDOS attacks. This does not bode well for the future of syncing the chain in my opinion.
The Number of Empty Blocks is Decreasing
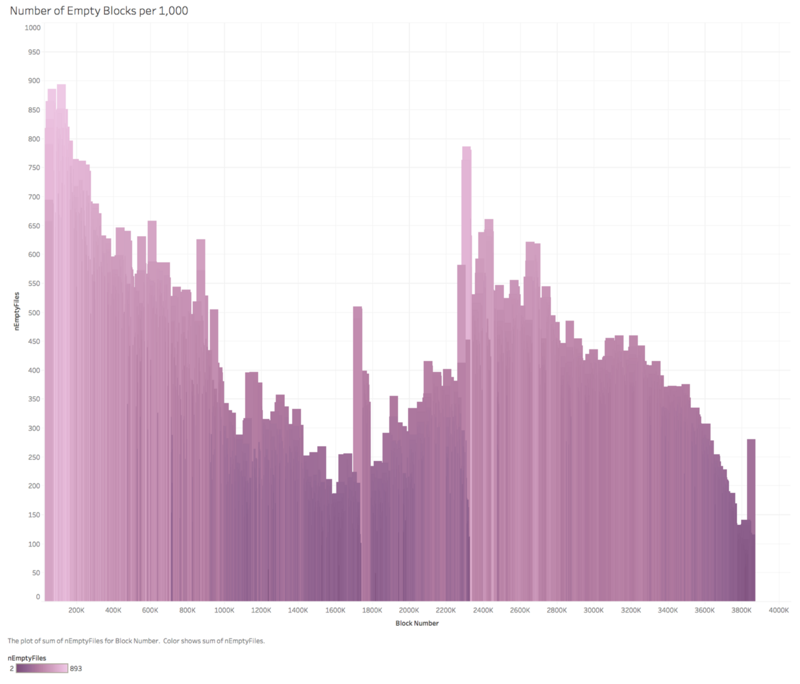
Another easy to obtain measure for the increased usage of the system is to count the number of empty blocks (that is blocks that contain zero transactions). While there are many reasons why a block may have zero transactions, one reason is simply that the number of transactions available to be processed is below the chain’s ability to keep up with. During the early part of the chain’s history, when there was significantly less activity, there were more empty blocks (significantly more, it turns out).
As one can see, recently the chain has experienced a sharp decrease in the number of empty blocks. This, we think, is indicative of the increased load on the system. On average, over the entire history of the chain, nearly 35% of all blocks contained no transactions. This number has recently dropped to near 10% of blocks.
Conclusion
There are many other charts we could produce. My guess is that all of them would indicate a huge increase in the growth of the storage requirements being placed on systems from the Ethereum network.
One of the charts I would to see is the rate of creation of new smart contracts. It is my guess that we would two sources of growth in this area: (1) regular growth from new users adding individual smart contracts, and (2) an increased use of the factory model of smart contract creation. In the factory model, smart contracts dynamically create other smart contracts. I’d like to further see how many of these new smart contracts are actively used. I suspect there are a huge number of smart contracts being created that are used once or twice and then never again.
I fear that this second method of smart contract creation will ultimately turn out to be a serious problem in the future. The large scale creation of single-use or low-use smart contracts is like pollution. It simply cannot be the case that a growing number of smart contracts can increasingly be automatically creating an growing number of child smart contracts without a very bad outcome.
With TrueBlocks we are attempting to build a system that allows us to see these overall trends. We need to know what’s happening on the entire system, and we need to pay attention to it because only by watching and studying what’s going on will we be able to anticipate future behavior of the system.
I think we all better start paying more attention. And some of us should stop polluting the blockchain with poor decisions.
I’d love to hear your thoughts. Please make a comment below. If you enjoy my musings, support my work by sending ether to our tip jar at 0xf503017d7baf7fbc0fff7492b751025c6a78179b.
Thomas Jay Rush owns the software company TrueBlocks whose primary project is also called TrueBlocks, a collection of software libraries and applications enabling real-time, per-block smart contract monitoring and analytics to the Ethereum blockchain. Contact him through the website.