Is the Ice Age Affecting Block Production?
Yes
This is just one of 100’s of questions we have about what is happening on the Ethereum blockchain. We’re developing TrueBlocks to help us answer these questions and more.
TrueBlocks is a set of software libraries, applications, and command line tools that provide fast, easy, fully-decentralized access to the Ethereum blockchain data. As part of preparing for our next release, we’ve written a a number of simple command line tools to test our code. One of these is called whenBlock which helped us answer the question above.
Here’s the help screen from whenBlock:
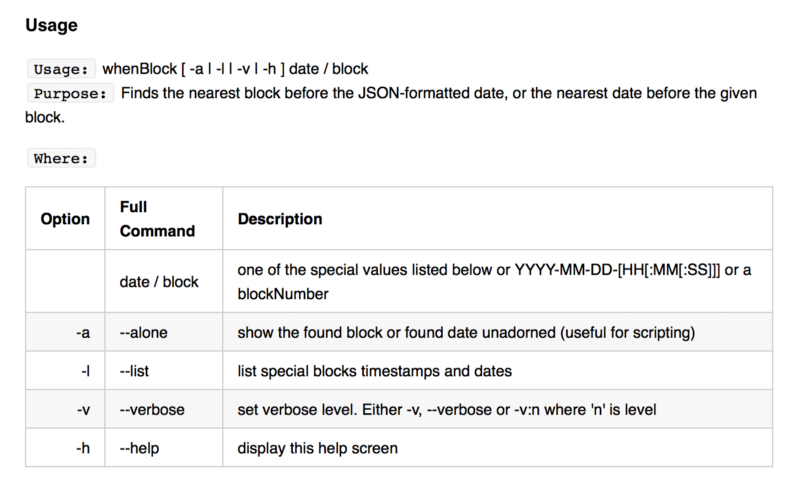
WhenBlock allows you to find the block number given a particular date or, conversely, a date given a particular block number. It’s very straight-forward (and was simple to write), but it’s surprisingly useful. We use it a lot when we’re syncing a node. There is nothing worse than waiting for Parity or Geth to sync. They only report the number of the current block. This has absolutely no meaning and is astonishingly frustrating — if you don’t believe me, take a look at the Ethereum Stack Exchange website which has a constant stream of questions asking how long the sync will take.
If you’re waiting for the node to sync, you can type whenBlock 2400000 on the command line, and it will respond with
block #2400000 : 1475896666 : 2016–10–08 03:17:46 UTC
telling you exactly how far along the sync is. Knowing that the sync is stuck on the October 2016 DDOS (which it almost always is) makes waiting for it to finish just a little bit more palatable.
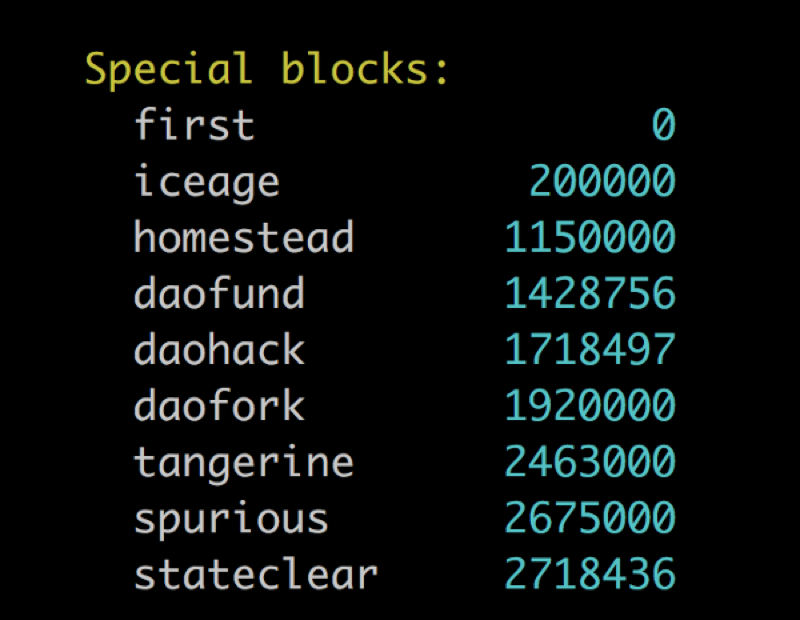
WhenBlock comes with a useful feature that lists so-called special blocks. By default the special blocks are those shown to the left, but you may add your own special blocks to a configuration file. Perhaps you wish to keep track of when you deployed your amazing new ERC20 tokens. The --verbose —-list option reports on other interesting blocks, such as the deployment dates of prominent token launches.
Answering Questions
The whole point of TrueBlocks is to allow end users to answer questions about the Ethereum blockchain. We aim to provide useful, scientific-quality information about the behaviour of the blockchain. Currently, one must rely either on a fully centralized solution such as EtherScan to get data or do without the data altogether — or accumulate it oneself, which is not easy if one hopes to get the data before the end of the century. TrueBlocks aims to provide better data, faster, than EtherScan, and to do so way more quickly, and in a 100% decentralized manner.
We used whenBlock to create a list of the block heights at the end of each week since the inception of the Ethereum blockchain. Here’s the data:
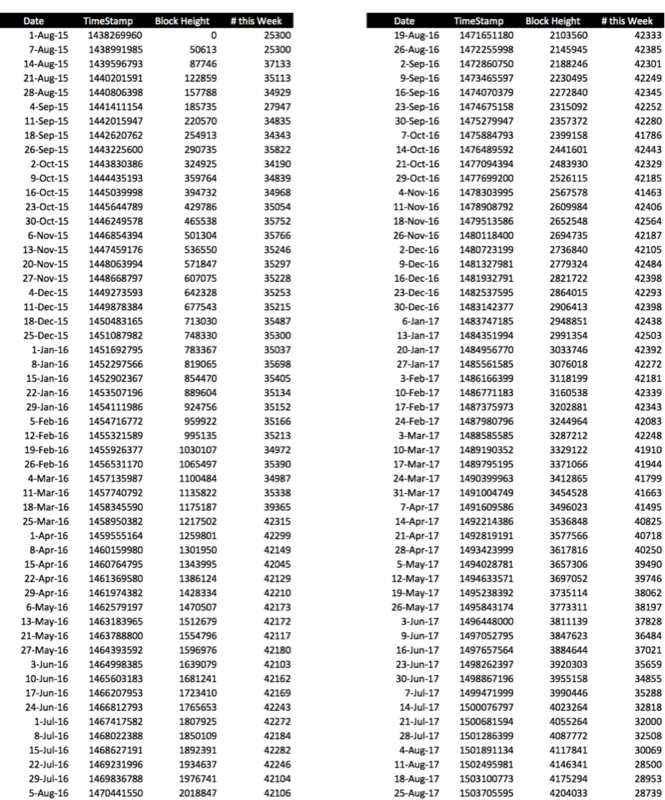
Our goal was to see how the difficulty bomb was affecting the number of blocks created each week. Here’s the same data displayed in a pretty blue, orange, and green chart:
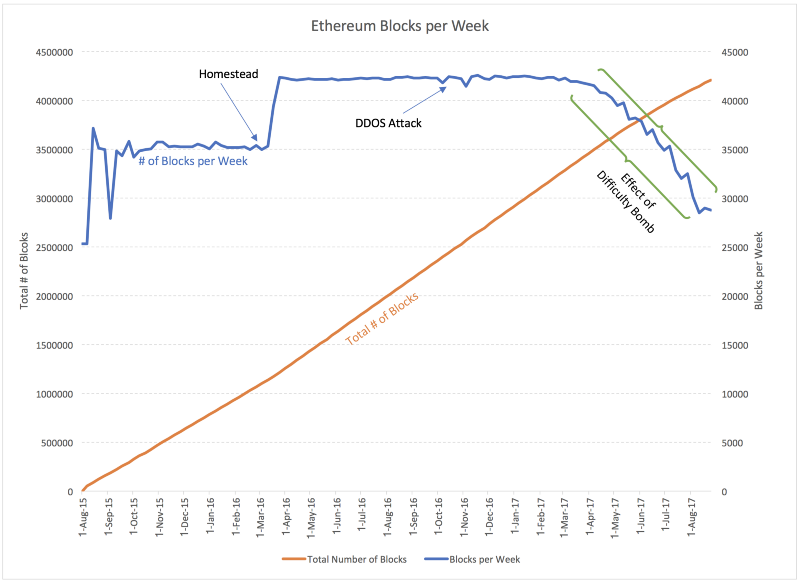
A number of things become fairly obviously from the chart:
- The number of blocks created per week is, overall, stable (as is revealed by the near-linear orange line — this is to be expected).
- One sees the orange line (the on-going block height) tail off just a bit in recent months due to the difficulty bomb.
- Better information is revealed when one looks at the number of blocks created per week (i.e. the blue line).
- The chain experienced large swings in the number of blocks produced per week in the early months. (I’m not sure why this is.)
- The Homestead release (block #1,150,00 — March 14, 2016) initiated a near-instantaneous (and fairly significant) increase in the number of blocks created per week.
- The number of blocks created per week remained quite stable for more than a year after the Homestead release.
- While the October 2016 DDOS attack had a visible effect on the chain (the two dips), it was not as pronounced as other effects (even though the DDOS did have a huge effect the blockchain’s initial sync).
- Starting around April of 2017, the difficulty bomb began to explode. It has been exploding ever since.
- The explosions of the difficulty bomb are staggered and growing larger each period. (I do not know the details of the difficulty calculation, but it is apparently a step function with exponentially growing increase.)
- The chain is almost to the point where the number of blocks produced per week is as low as it’s ever been.
There’s a lot more we could do to explore the effect of the difficulty bomb (for example, it would be interesting to see if the number of transactions processed has seen a commensurate decrease). Unfortunately, we have to go back to the salt mine of our programming environment to finish up the release. Stay tuned. We’ll post another post similar to this one in after the Byzantium hard fork. We should see a pretty large rise in the number of blocks per week.
The data supporting this post was generated with TrueBlocks. Visit our GitHub repo.
We’re interested in your thoughts. Please clap for us and then post your comments below. If you enjoy our work, please consider supporting us by sending a tip to 0xf503017d7baf7fbc0fff7492b751025c6a78179b.
Join our discord server There’s not a lot of people there, but hopefully there will be soon.
Thomas Jay Rush owns the software company TrueBlocks whose primary project is also called TrueBlocks, a collection of software libraries and applications enabling real-time, per-block smart contract monitoring and analytics to the Ethereum blockchain. Contact him through the website.