Ethereum Block Production Continues to Slide
All the news that's fit to blog about
Two weeks ago, we wrote this Medium post in which we describe the slowdown in per-week block production due to the Ice Age or Ethereum Difficulty Bomb. We thought it would be interesting to continue to watch the process as it unfolds. We wondered “Is the difficulty bomb having its desired effect”?
The following chart is the one we presented two weeks ago. It shows the number of blocks produced each week since the inception of the Ethereum chain (August, 2015). The slowdown in block production is readily apparent.
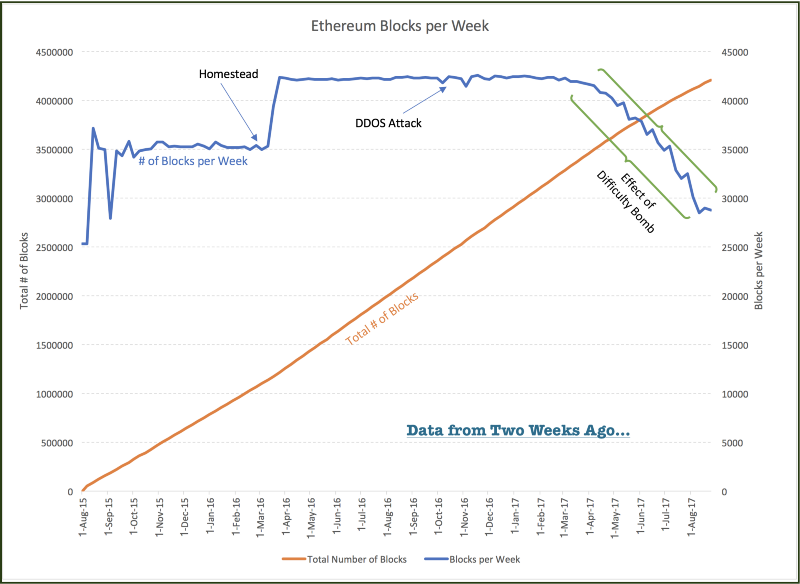
Ruh Roh George Jeston!
Here’s that same chart two weeks later:
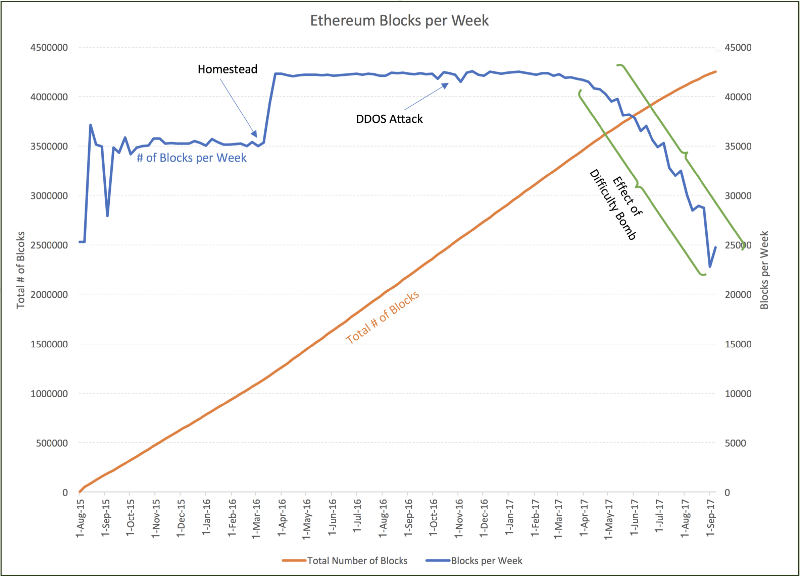
As you can see, the difficulty bomb — whose nominal purpose is to slow down block production — is working…very well. The number of blocks produced during the week ending September 8, 2017 was as low as it’s been since the inception of the chain. Interesting.
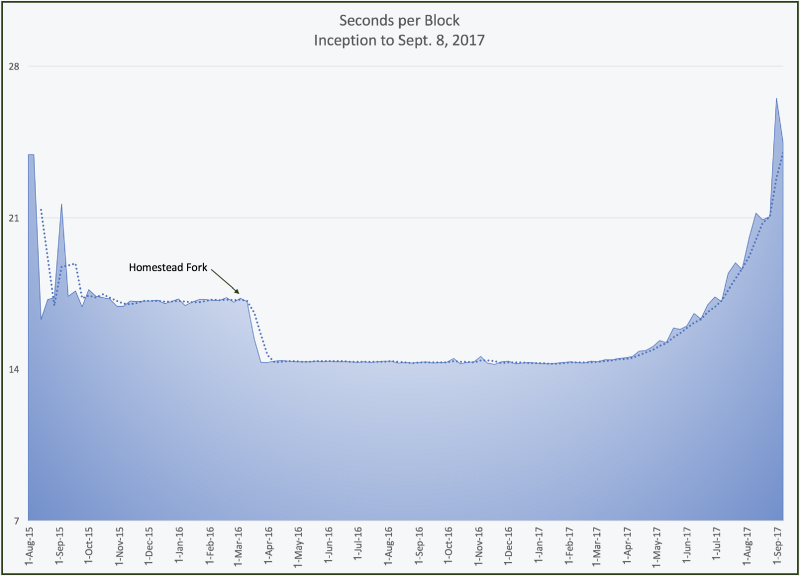
The inverse of the lowering of the number of blocks produced per period is the time it takes to produce each block. Here, the exponential decrease in per-period block production is more apparent. In this chart we show the number of seconds it takes to create each block on average since inception. As you can see, after the Homestead fork, the number of seconds needed to produce a block hovered almost exactly on 14 seconds for more than a year. It’s been rapidly increasing since April when the difficulty bomb began. The step-wise behaviour of the increase is also apparent if one looks closely.
Does “Less Blocks” Mean “Less Transactions”?
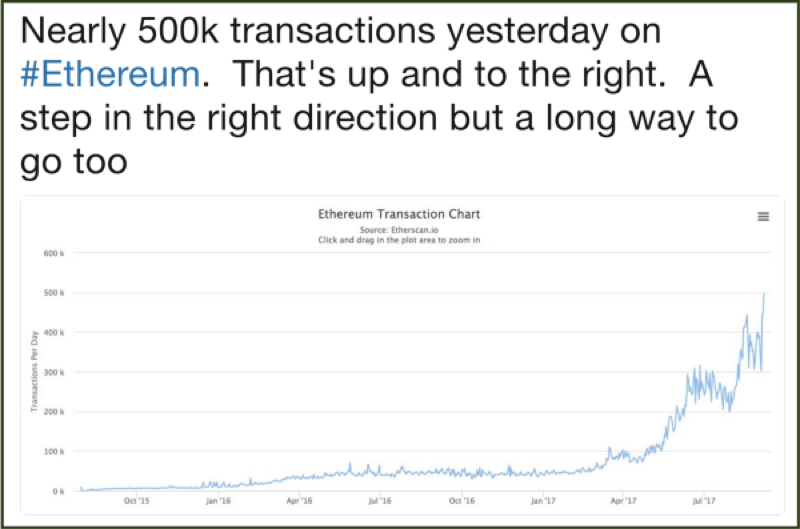
Given tweets such as the one to the left and this one, which seem to contradict the idea that there are less blocks being produced, we wondered if “increasing transactions” and “less blocks” could both be true at the same time. If the number of transactions is increasing, and the number of blocks is decreasing, then the number transactions per block must be skyrocketing. We should be able to see this effect.
In the following analysis we used TrueBlocks (running against a local node which was running on a laptop — TrueBlocks is fully decentralized, remember) to accumulate the number of externally-initiated transactions for each week between August 1, 2015 until Sept. 8, 2017. We wanted to see if a lessening of the number of blocks had any discernible effect on the number of transactions processed.
Our hypothesis, before we completed the analysis, was that the number of transactions was increasing but maybe not as quickly as it would be without the difficulty bomb. We felt this might be true for two reasons: (1) the amount of interest in the Ethereum blockchain is exploding, and (2) there was probably capacity in the system.
There were three tasks ahead of us. First, we wanted to see if the number of transactions per period was rising or lowering. Secondly, in order to separate the effect of a lower number of blocks from an increased interest in Ethereum, we needed to know how many new accounts were being created during those same periods under the assumption that new account creation is a stand-in for adoption. And, finally, we would need to see if the per-block gas limit was having an effect. The gas limit would cap the number of transactions that could be included in a given block and would appear as a flat line in the charts.
To keep this article short, we will present only the first of these three investigations. Please return next Friday, when we will publish next week’s blocks-per-week chart and further explore this issue.
Number of Transactions
Below we present the number of transactions per block, which, as you can see, has recently increased significantly. The blocks are definitely getting fuller.
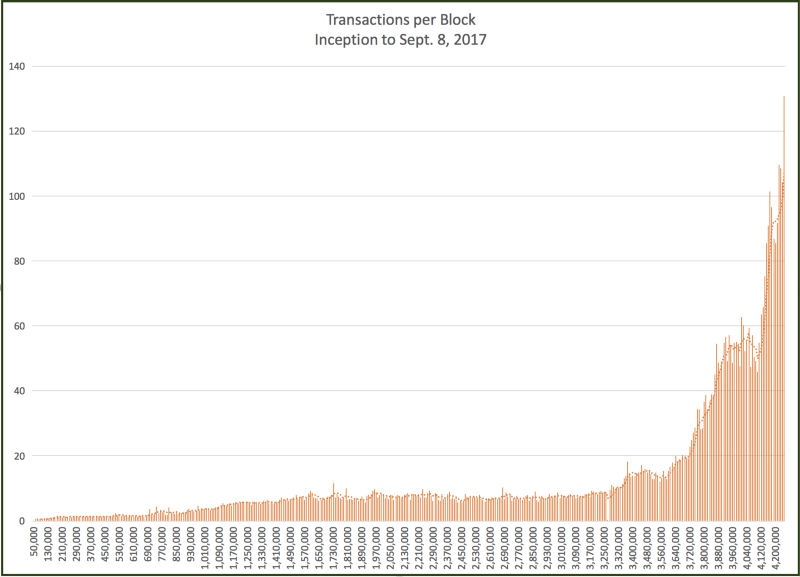
The huge increase in the number of transactions per block is doubly intensified by the increase in interest in the Ethereum chain and the simultaneous lowering in the number of blocks per period. But looking at transactions per block doesn’t really show what we’re after, we needed one more chart (plus — we like making charts).
This next chart is a bit surprising to be honest.
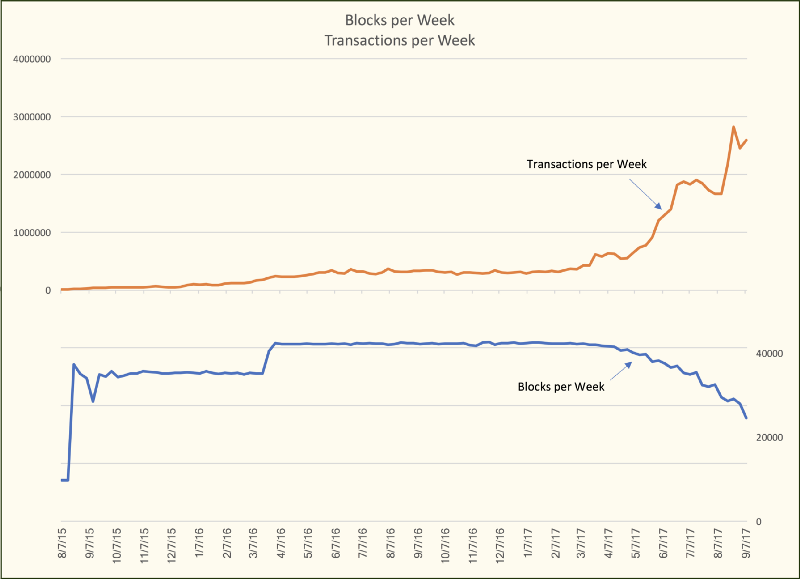
It does clearly reveal why the previous chart shows such a huge increase in transactions per block. Half as many blocks…twice as many transactions…means four times as many transactions per block. While it is not clear without further information if the number of transactions would be higher in the absence of the difficulty bomb, there is a slight hint at a bumpiness in the uptick of adoption (as represented by number of transactions). One would think that increased adoption would be more smooth without the effect imposed by the difficulty bomb.
Stay Tuned…
This article is getting a little long-winded, so we’ll stop for now. The goal of the series (here’s last week’s) is to discern what effect, if any, the difficulty time bomb is having on the ecosystem.
The raison-d’etre of the difficulty time bomb was to force Ethereum miners to accept an upgrade to the node software. Is it serving that purpose?
In a certain sense, the pressure applied on the miners to accept this “forced upgrade” comes from the community as the system slows down. But — is the system slowing down from the perspective of a regular user if the number of transactions being processed per period is increasing in lock-step with the number of new users? (We’ll explore this next week.)
Another pressure imposed on the miners, of course, is to accept the “forced upgrade” because of the lessening of the “potential” income per period. If there are less blocks over a given time frame, there are less rewards available for the winner of the block, and therefore less income to miners.
To what extent does the increasing number of transactions (and therefore the increasing transaction fees) offset the lost block rewards? On top of that, is the price of gas increasing or lessening, and what effect does that have on the situation? Furthermore, if the price of ether in US dollars is rising (as it has over the last few weeks), does that ameliorate the effect of the difficulty bomb?
Even worse — can anyone ever possibly enumerate and untangle all the intertwined effects of these things influencing each other and how can TrueBlocks help?
The data supporting this post was generated with TrueBlocks. Visit our GitHub repo.
We’re interested in your thoughts. Please clap for us and then post your comments below. If you enjoy our work, please consider supporting us by sending a tip to 0xf503017d7baf7fbc0fff7492b751025c6a78179b.
Join dicord channel There’s not a lot of people there yet, but hopefully there will be soon.
Thomas Jay Rush owns the software company TrueBlocks whose primary project is also called TrueBlocks, a collection of software libraries and applications enabling real-time, per-block smart contract monitoring and analytics to the Ethereum blockchain. Contact him through the website.